Geospatial Distribution of Fatalities by Country
District-Level Fatalities Concentration Map
Treemap of Fatalities by Region and District
Stacked bar chart of Fatalities by Region
The chart above visualizes the number of fatalities in the Gaza Strip, Israel, and the West Bank from the year 2000 up until September 2023. Notable peaks in fatalities correspond to significant conflicts and military operations within the region.
Key Observations
- 1. There are several peaks in the data that align with major conflicts or military operations. For instance, the significant peak in the Gaza Strip around 2014 corresponds with Operation Protective Edge Operation Protective Edge , a conflict between Israel and Hamas during July and August of that year.
- 2. Other smaller peaks might correspond to events such as the Second Intifada in the early 2000s, the Gaza War (Operation Cast Lead) in late 2008 to early 2009, and periodic escalations in violence and military operations in subsequent years.
- 3. The overall trend in the Gaza Strip and the West Bank shows that periods of increased fatalities are often followed by relative lulls. These could be due to ceasefires, periods of intensified diplomacy, or other factors that temporarily reduce conflict intensity.
- 4. The data for Israel shows fewer fatalities than in the Gaza Strip and West Bank, which could reflect the asymmetry in the conflict's impact on different populations.
Marimeko Chart of Fatalities along Age, Gender and Citizenship
Area Chart of Fatalities by 'Killed By' Category
Note: This area chart illustrates distinct peaks that correspond to significant events in the Israeli-Palestinian conflict. The reasons behind these peaks have been discussed here.
In the year 2000, the fatalities recorded in the conflict were predominantly caused by civilians from both Israeli and Palestinian sides, with no significant involvement noted from security forces. This initial period reflects a civilian-led impact on the fatality figures.
By 2002, there was a marked increase in the number of deaths attributed to Palestinian actions, representing the highest peak in fatalities caused by Palestinian individuals throughout the observed timeline. Following this peak, there was a decline in such incidents, with occasional spikes that indicate intermittent escalations in the conflict.
However, it's evident that the majority of fatalities during these years were caused by Israeli security forces. This sustained pattern underscores the significant role of military and security operations in the conflict's fatality rates and points to the asymmetrical nature of the violence experienced during these years.
Bubble Chart of fatalities by Citizenship and Ammunition
This bubble chart presents a stark visualization of the types of ammunition used in the conflict. It shows that the most commonly used weapons by Israeli security forces are missiles and live ammunition, depicted by the larger bubbles in those categories. On the Palestinian civilian side, the prevalent use of explosive belts and bombs is noticeable, emphasizing the different tactics and resources available to each side.
The predominance of missiles and live ammunition reflects the advanced military capabilities of the Israeli forces. Conversely, the use of explosive belts and bombs by Palestinian civilians indicates more improvised means of conflict
Treemap of % Fatalities by Citizenship Took Part in Hostilities
Word clouds from conflict reports by citizenship
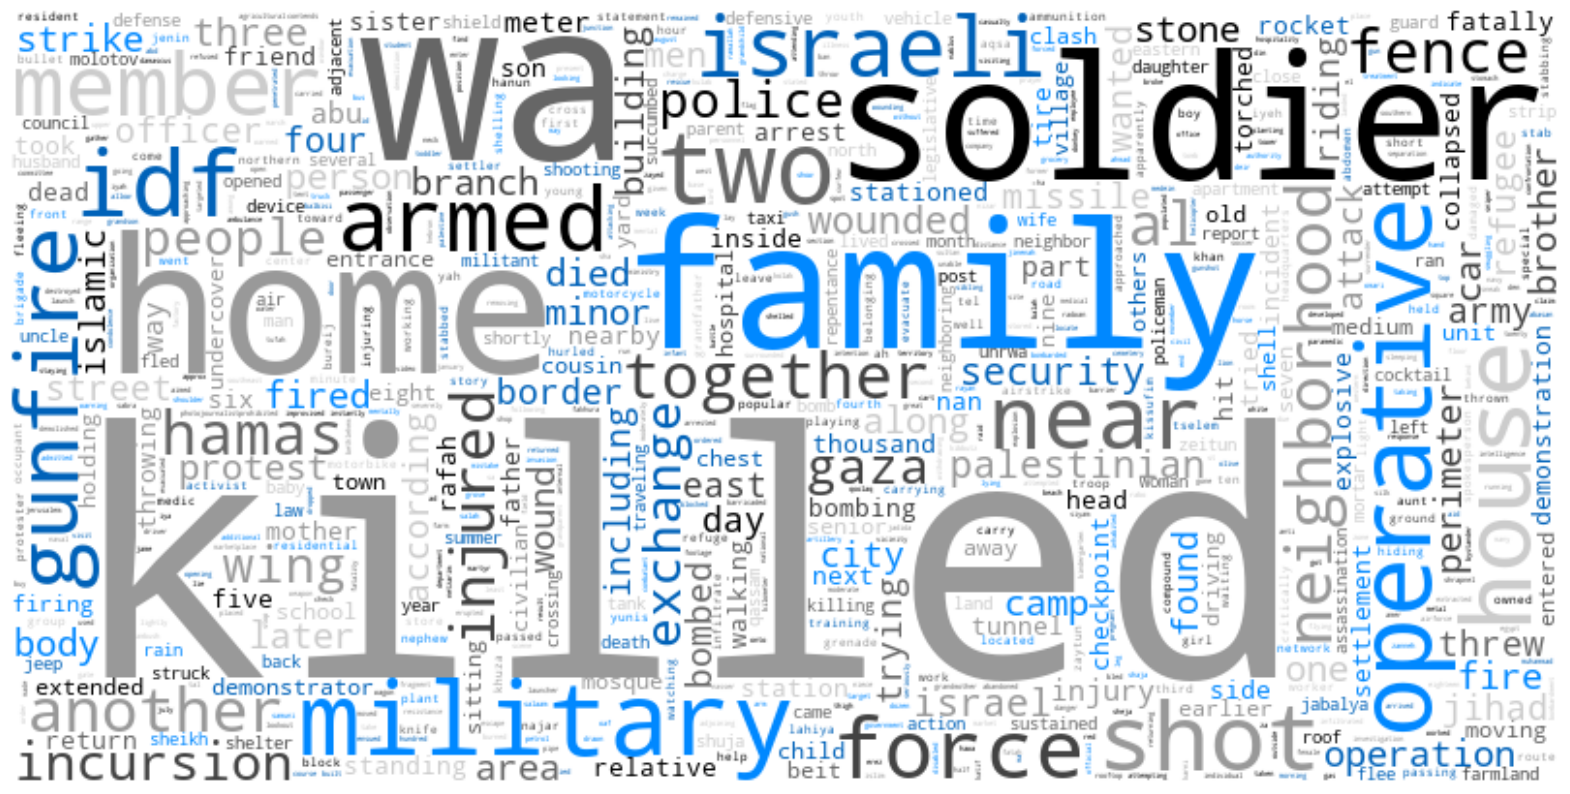
Palestinian Notes WordCloud

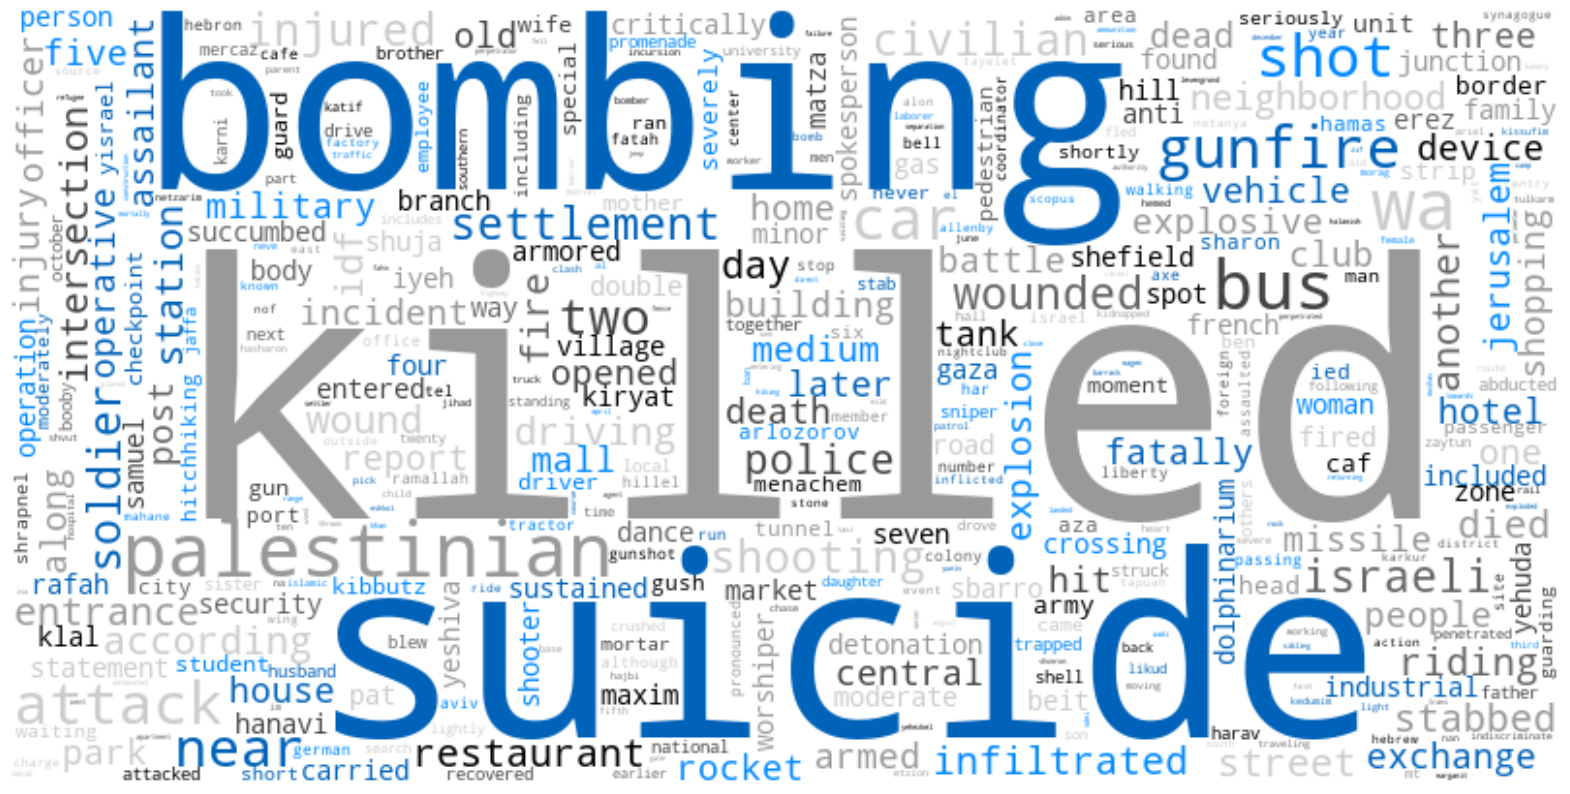
Israeli Notes WordCloud

Conclusions
The series of visualizations reviewed provides a comprehensive view of the Israeli-Palestinian conflict from 2000 to September 2023, revealing critical patterns and consequences in both the geographic and demographic dimensions.
The geospatial distribution of fatalities highlights a notable disparity, with a disproportionate percentage of fatal incidents occurring in Palestinian territories. The concentration of fatalities in the Gaza district is particularly pronounced, accounting for more than 70% of the events cataloged. Within the Gaza Strip itself, the Gaza district bears the brunt with 2,435 fatalities, followed closely by North Gaza with 1,910. These figures not only illustrate the intensity of the conflict in specific areas but also reflect differences in the distribution of fatalities among various regions and districts, underscoring the need for a differentiated approach in humanitarian response and policy formulation.
The Marimekko chart breaks down fatalities across the dimensions of age, gender, and citizenship, showing that the majority of the deceased are Palestinian males under the age of 29. This pattern suggests a disproportionate loss of young lives, which has profound implications for the demographic structure of Palestinian society and its future.
Word clouds derived from notes on conflict events highlight the frequency of terms such as 'family', 'home', 'military', and 'operative', reflecting the inextricable link between the domestic sphere and armed conflict. The terms 'bombing' and 'suicide' in the Israeli word cloud, combined with the prevalence of 'explosive belts' and 'bombs' in the Palestinian one, provide a clear understanding of the tactics used and the extent of damage inflicted on the civilian population.
The implications of these data are multiple and profound. While the fatality figures provide an account of the loss of life, the nature of the weapons used and the locations of the incidents reveal the proximity of the conflict to everyday life. The analysis underscores the importance of risk mitigation and civil protection strategies that can reduce the human impact of the conflict.
The prominent presence of terms related to armament and military tactics on both sides signals the intensity of operations and the escalation of hostilities. However, the high proportion of fatalities who did not actively participate in the hostilities, particularly on the Palestinian side, highlights the serious reality of collateral damage and civilian victims.
Together, these visualizations do not merely tell the story of the conflict through numbers but also humanize the data by highlighting the impact on individuals and communities. This analysis calls for reflection on the urgency of constructive dialogue and the search for lasting peace, emphasizing the need to address not only the political dimensions but also the human aspects of the conflict.


